Explore KC Exits, Equity, Rankings and More in the New 2019 We Create Capital Data
Every year, KCSourcelink takes a look at how capital flows through the Kansas City region, and the 2019 data is now out.
One question frequently asked in the equity investment space is whether investors are seeing a return on their investment into early-stage companies. Using data from a variety of public and private sources we here at KCSourceLink have tracked the number of equity-backed companies that were acquired over the past five years. (Just an FYI that that data is not available to determine the value of the acquisitions or the actual ROI to investors.)
KCSourceLink’s annual look at capital in Kansas City revealed a few other points of interest:
- The total value of equity investments and grants in 2019 was $566 billion, compared with $350 billion in 2018 (not including IPOs). The number of deals was similar: 110 in 2019 vs 112 in 2018.
- In 2019, Kansas City was ranked 7 out of 15 peer cities in terms of value of equity investments but continued to rank near the bottom (14 out of 15) in the number of deals.
- Local investors are stepping up, with 26 of 29 under $100,000 investments from local investors where the geography of investor was known. Three local investors were involved in deals over $10 million.
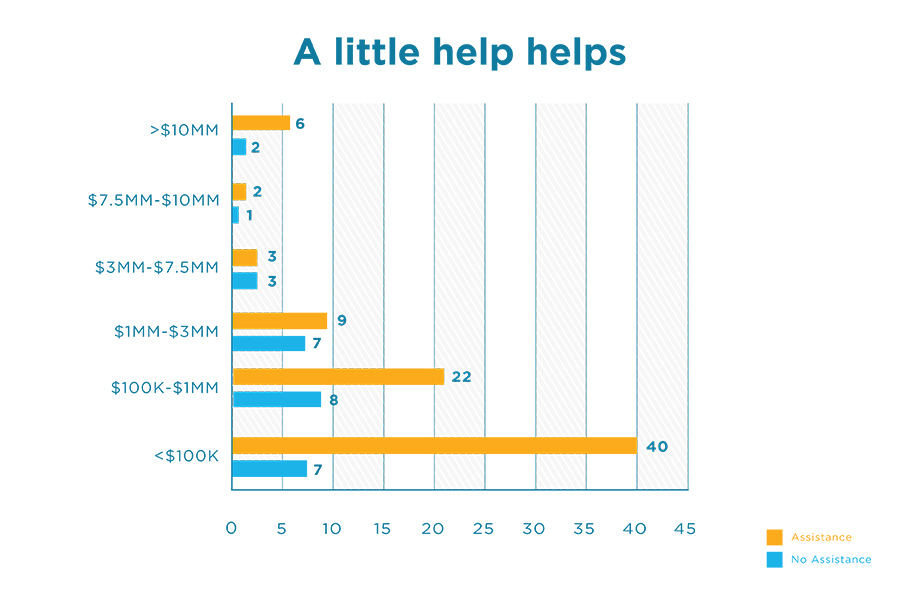
- Assistance is important. Overall, 75% of the companies that raised investment or won grants received assistance from a Resource Partner in the KCSourceLink network. Also, 85% of companies that raised less than $100,000 got help.

“This data demonstrates that Kansas City is continuing to grow and strengthen its capital continuum for early-stage companies,” said Jill Meyer, senior director of technology ventures at the UMKC Innovation Center. “It’s so important that we fill the early part of the pipeline so that more companies are able to grow and prosper.”
In 2018, KCSourceLink created an online Capital Dashboard that demonstrates how capital is deployed in a 100-mile radius of the Kansas City metro center. This interactive dashboard shows investment by location, industry and size of investment. Users can filter the data—by state, total dollars invested, number of businesses that received investment and number of investments—separately or in concert to gather deeper insights into Kansas City’s capital landscape. An additional history chart reflects the various numbers/amounts for the past five years.
Find more data at kcsourcelink.com/wecreate/entrepreneur-dashboard-capital.


Leave a Reply