How Capital Flows through the KC Region: Explore Our Interactive Capital Dashboard
How many dollars were raised by Kansas City startups located in Missouri? What are the top three industries in the KC region by investment size? What metro area can claim the most dollars raised in the health care industry?
Answers: $640 million; internet, financial and health care; and Lawrence, Kansas. And these are just three of the many questions that KCSourceLink’s new Capital Dashboard can answer.
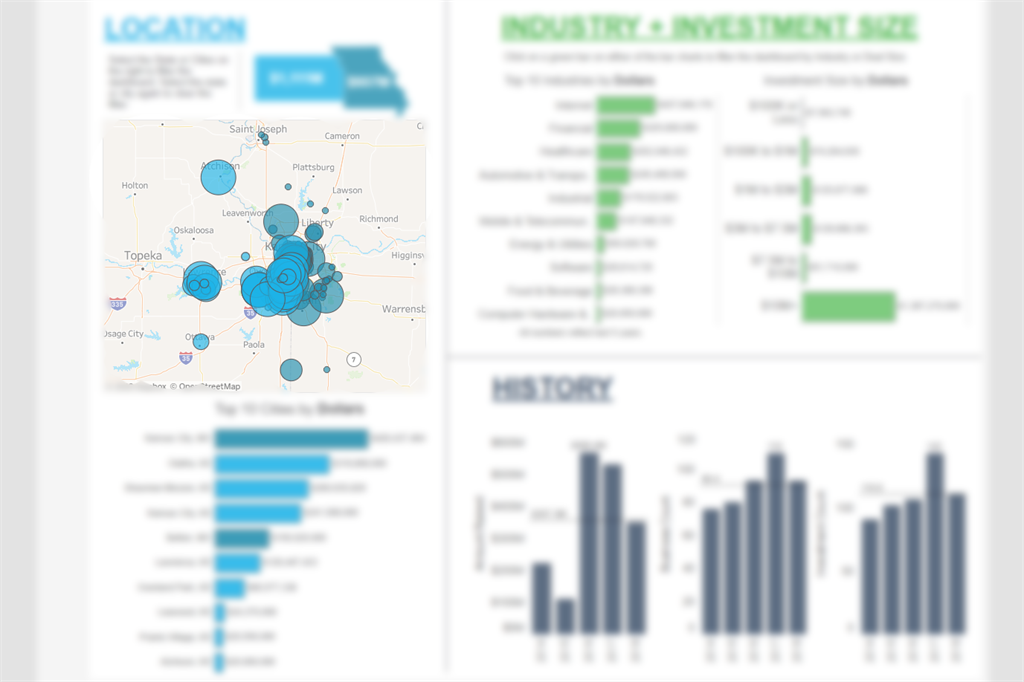
Using Tableau data visualization software, the KCSourceLink Capital Dashboard demonstrates how capital is deployed in a 100-mile radius of the Kansas City metro center.
Click here or on the image below to explore the interactive Capital Dashboard.
This interactive dashboard shows investment by location, industry and size of investment. Users can filter the data—by state, total dollars invested, number of businesses that received investment and number of investments—separately or in concert to gather deeper insights into Kansas City’s capital landscape. An additional history chart reflects the various numbers or amounts for the past five years.
KCSourceLink has been tracking the flow of equity capital and grants into Kansas City companies since the publication of its first We Create Capital report and strategic plan in 2015. For the past four years, KCSourceLink has reported on the number, value and category of deals over time in static, stand-alone charts. This interactive dashboard allows users to dig deeper into that data to glean richer, dimensional insights.
“At KCSourceLink we not only connect entrepreneurs to resources, we also look for gaps in those resources,” said Maria Meyers, founder of KCSourceLink and executive director of the UMKC Innovation Center. “This interactive dashboard will allow us to better see how investments impact and shape our startup community. We invite people to play with the dashboard and give us their feedback.”


Leave a Reply